| This release should be read with the Company’s Financial Statements and Management Discussion & Analysis ("MD&A"), available at www.tasekomines.com and filed on www.sedar.com. Except where otherwise noted, all currency amounts are stated in Canadian dollars. Taseko’s 87.5% owned Gibraltar Mine is located north of the City of Williams Lake in south-central British Columbia. Production and sales volumes stated in this release are on a 100% basis unless otherwise indicated. |
March 7, 2024, Vancouver, BC – Taseko Mines Limited (TSX: TKO; NYSE American: TGB; LSE: TKO) ("Taseko" or the "Company") reports full year 2023 Adjusted EBITDA* of $190 million and Earnings from mining operations before depletion and amortization* of $207 million. Revenues for 2023 were $525 million, 34% higher than the prior year as a result of improved copper production and an increase in the Company’s effective interest in the Gibraltar Mine, from 75% to 87.5%, in March 2023. Net income for the year was $83 million ($0.29 per share) and Adjusted net earnings* were $44 million ($0.15 per share).
In the fourth quarter, Adjusted EBITDA* was $69 million and Earnings from mining operations before depletion and amortization* was $73 million. Net income for the fourth quarter was $67 million ($0.23 per share) and Adjusted net earnings* was $24 million ($0.08 per share).
Fourth quarter copper production from Gibraltar was 34 million pounds, and for the full year 2023 production was 123 million pounds. Annual production was above the Company’s original guidance and also 26% higher than in 2022. Strong production supported lower Total operating cash costs (C1)* of US$1.91 per pound for the fourth quarter and US$2.37 per pound for the year. Molybdenum production for the fourth quarter and year was 369 thousand pounds and 1.2 million pounds, respectively.
Stuart McDonald, President and CEO of Taseko, commented, “The Gibraltar Mine finished a successful year with another strong production quarter. The lower benches of the Gibraltar pit continued to deliver the quality ore we expected, with copper grades averaging 0.27% for the period. This resulted in strong earnings and $63 million of operating cash flow in the fourth quarter. For the full year 2023, the average copper grade was 0.25%, which is in line with Gibraltar’s life of mine reserve grade, and led to significantly improved copper production and financial performance compared to 2022.
“At our Florence Copper project we achieved a major milestone in the fourth quarter, as the final Underground Injection Control permit became effective, successfully concluding the EPA’s lengthy permitting process. We also announced two Florence project financings totalling US$100 million, from Taurus Mining Royalty Fund and Societe Generale, which supplement the previously announced financings from Mitsui and Bank of America.
We’re now moving forward with construction of the commercial production facility at Florence. Initial activities have focused on site preparations, earthworks and civil work for the wellfield as well as hiring additional site personnel for the construction and operations teams. Wellfield drilling commenced in February and construction of the SX/EW plant and other surface infrastructure will begin in the second quarter. First copper production expected in fourth quarter 2025.”
Mr. McDonald added, “Taseko is in a very unique position heading into 2024 with a fully permitted, low-cost project that will provide 80% growth to our North American copper production profile in the coming years. Our Gibraltar Mine is expected to continue to benefit from Gibraltar pit ore which will be the main source of mill feed for the first half of this year, before the transition to the Connector pit. In January, we had mill downtime in concentrator #2 for a planned major component replacement, which was successfully completed in the scheduled timeframe. In the second quarter, concentrator #1 will be shut down for roughly three weeks for the in-pit crusher relocation and other mill maintenance. Factoring in the additional down time in 2024, we expect Gibraltar to produce approximately 115 million pounds of copper for the year, with quarterly production less variable than in recent years,” concluded Mr. McDonald.
2023 Annual Review
- Annual cash flow from operations was $151.1 million and net income was $82.7 million ($0.29 per share) for the year;
- Earnings from mining operations before depletion and amortization* was $207.4 million, Adjusted EBITDA* was $190.1 million and Adjusted net income* was $44.4 million ($0.15 per share);
- Total operating costs (C1)* for the year was US$2.37 per pound produced;
- The Gibraltar mine produced 122.6 million pounds of copper and 1.2 million pounds of molybdenum in 2023. Copper recoveries averaged 82.6% and copper head grades were 0.25%;
- Gibraltar sold 120.7 million pounds of copper for the year (100% basis) which contributed to revenue for Taseko of $525.0 million, the highest annual revenue Taseko has ever recorded. Average realized copper prices were US$3.84 per pound for the year;
- On March 15, 2023, Taseko acquired 50% of Cariboo Copper Corp. increasing its effective interest from 75% to 87.5% in the Gibraltar mine; and
- In September, the U.S. Environmental Protection Agency (“EPA”) issued the Final Underground Injection Control (“UIC”) permit for the Florence Copper Project and the permit became effective on October 31, 2023. The Company now has all key permits in place and is commencing construction of the commercial production facility at Florence.
Fourth Quarter Review
- Fourth quarter cash flow from operations was $62.8 million and net income was $67.4 million ($0.23 per share) for the quarter;
- Earnings from mining operations before depletion and amortization* was $73.1 million, Adjusted EBITDA* was $69.1 million, and Adjusted net income* was $24.1 million ($0.08 per share);
- Gibraltar produced 34.2 million pounds of copper for the quarter. Average head grades were 0.27% and copper recoveries were 82.2% for the quarter;
- Gibraltar sold 35.9 million pounds of copper in the quarter (100% basis) at an average realized copper price of US$3.75 per pound;
- Total operating costs (C1)* for the quarter was US$1.91 per pound produced;
- Construction of the commercial production facility at Florence is advancing with recent site activities focused on site preparations, earthworks and civil work for the commercial wellfield. Wellfield drilling commenced in February and construction of the SX/EW plant and associated surface infrastructure is scheduled to get underway in the second quarter of 2024;
*Non-GAAP performance measure. See end of news release
Fourth Quarter Review - Continued
- During the quarter, the Company closed the first Florence project debt facility with Bank of America for gross proceeds of US$25 million, secured against the SX/EW plant and other equipment;
- The Company had a cash balance of $96.5 million and has approximately $176 million of available liquidity at December 31, 2023; and
- On February 2, 2024, the Company closed its US$50 million royalty with Taurus Mining Royalty Fund L.P. (“Taurus”) and the Company also received the first US$10 million of the US$50 million Mitsui copper stream financing in January 2024.
Highlights
| Operating Data (Gibraltar - 100% basis) |
Three months ended
December 31, |
Year ended
December 31, |
| |
2023 |
2022 |
Change |
2023 |
2022 |
Change |
| Tons mined (millions) |
24.1 |
22.9 |
1.2 |
88.1 |
88.7 |
(0.6) |
| Tons milled (millions) |
7.6 |
7.3 |
0.3 |
30.0 |
30.3 |
(0.3) |
| Production (million pounds Cu) |
34.2 |
26.7 |
7.5 |
122.6 |
97.0 |
25.6 |
| Sales (million pounds Cu) |
35.9 |
25.5 |
10.4 |
120.7 |
101.3 |
19.4 |
| Financial Data |
Three months ended
December 31, |
Year ended
December 31, |
| (Cdn$ in thousands, except for per share amounts) |
2023 |
2022 |
Change |
2023 |
2022 |
Change |
| Revenues |
153,694 |
100,618 |
53,076 |
524,972 |
391,609 |
133,363 |
| Cash flows provided by (used for) operations |
62,835 |
(946) |
63,781 |
151,092 |
81,266 |
69,826 |
| Net income (loss) (GAAP) |
67,425 |
(2,275) |
69,700 |
82,726 |
(25,971) |
108,697 |
| Per share - basic (“EPS”) |
0.23 |
(0.01) |
0.24 |
0.29 |
(0.09) |
0.38 |
| Earnings from mining operations before depletion and amortization* |
73,106 |
37,653 |
35,453 |
207,354 |
106,217 |
101,137 |
| Adjusted EBITDA* |
69,107 |
35,181 |
33,926 |
190,079 |
109,035 |
81,044 |
| Adjusted net income* |
24,060 |
7,146 |
16,914 |
44,431 |
1,723 |
42,708 |
| Per share - basic (“Adjusted EPS”) * |
0.08 |
0.02 |
0.06 |
0.15 |
0.01 |
0.14 |
On March 15, 2023, the Company increased its effective interest in the Gibraltar Mine from 75% to 87.5% through the acquisition of a 50% interest in Cariboo Copper Corp. The financial results reported in this MD&A include the Company’s 87.5% proportionate share of Gibraltar Mine income and expenses for the period March 15 to December 31, 2023 (prior to March 15, 2023 – 75%).
*Non-GAAP performance measure. See end of news release
Review of Operations
Gibraltar mine
| Operating data (100% basis) |
Q4 2023 |
Q3 2023 |
Q2 2023 |
Q1 2023 |
Q4 2022 |
YE 2023 |
YE 2022 |
| Tons mined (millions) |
24.1 |
16.5 |
23.4 |
24.1 |
22.9 |
88.1 |
88.7 |
| Tons milled (millions) |
7.6 |
8.0 |
7.2 |
7.1 |
7.3 |
30.0 |
30.3 |
| Strip ratio |
1.5 |
0.4 |
1.5 |
1.9 |
1.1 |
1.3 |
1.8 |
| Site operating cost per ton milled (Cdn$)* |
$9.72 |
$12.39 |
$13.17 |
$13.54 |
$13.88 |
$12.16 |
$11.89 |
| Copper concentrate |
|
|
|
|
|
|
|
| Head grade (%) |
0.27 |
0.26 |
0.24 |
0.22 |
0.22 |
0.25 |
0.20 |
| Copper recovery (%) |
82.2 |
85.0 |
81.9 |
80.7 |
83.4 |
82.6 |
79.5 |
| Production (million pounds Cu) |
34.2 |
35.4 |
28.2 |
24.9 |
26.7 |
122.6 |
97.0 |
| Sales (million pounds Cu) |
35.9 |
32.1 |
26.1 |
26.6 |
25.5 |
120.7 |
101.3 |
| Inventory (million pounds Cu) |
6.9 |
8.8 |
5.6 |
3.7 |
5.4 |
5.6 |
5.4 |
| Molybdenum concentrate |
|
|
|
|
|
|
|
| Production (thousand pounds Mo) |
369 |
369 |
230 |
234 |
359 |
1,202 |
1,118 |
| Sales (thousand pounds Mo) |
364 |
370 |
231 |
225 |
402 |
1,190 |
1,131 |
| Per unit data (US$ per pound produced)* |
|
|
|
|
|
|
|
| Site operating costs* |
$1.59 |
$2.10 |
$2.43 |
$2.94 |
$2.79 |
$2.19 |
$2.85 |
| By-product credits* |
(0.13) |
(0.23) |
(0.13) |
(0.37) |
(0.40) |
(0.20) |
(0.23) |
| Site operating costs, net of by-product credits* |
$1.46 |
$1.87 |
$2.30 |
$2.57 |
$2.39 |
$1.99 |
$2.62 |
| Off-property costs |
0.45 |
0.33 |
0.36 |
0.37 |
0.36 |
0.38 |
0.36 |
| Total operating costs (C1)* |
$1.91 |
$2.20 |
$2.66 |
$2.94 |
$2.75 |
$2.37 |
$2.98 |
*Non-GAAP performance measure. See end of news release
Operations Analysis
Full Year Results
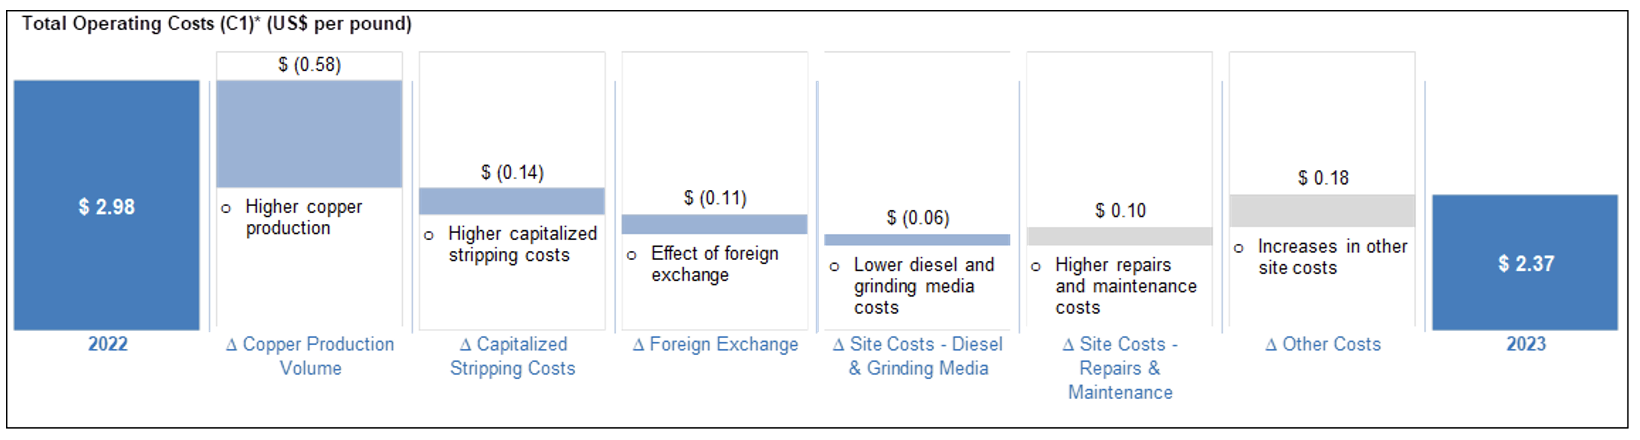
Gibraltar produced 122.6 million pounds of copper for the year compared to 97.0 million pounds in 2022. The higher production was attributable to improved ore grades and recoveries as the lower benches of the Gibraltar pit provided the expected higher grades and more consistent mineralized zones. Copper grades for the year averaged 0.25% copper compared to 0.20% in 2022 and copper recoveries for 2023 were 82.6% compared to 79.5% in 2022.
A total of 88.1 million tons were mined in the year compared to 88.7 million tons mined in 2022. The strip ratio of 1.3 was lower than the prior year as mining operations were focused in the Gibraltar pit in 2023 which has a lower strip ratio. Ore stockpiles also increased by 9.1 million tons, including oxide ore from the upper benches of the Connector pit.
Total site costs* at Gibraltar of $430.7 million (which includes capitalized stripping of $55.6 million) was $28.3 million higher than 2022, primarily due to higher repairs and maintenance costs and labour costs, partially offset by lower diesel costs and lower grinding media costs.
Molybdenum production was 1.2 million pounds in the year compared to 1.1 million pounds in the prior year. Molybdenum prices strengthened in 2023 with an average molybdenum price of US$24.19 per pound, an increase of 29% compared to the 2022 average price of US$18.73 per pound.
Off-property costs per pound produced* were US$0.38 for the year, which is US$0.02 higher than the prior year primarily due to an increase in treatment and refining charges (TCRC) rates.
Total operating costs per pound produced (C1)* was US$2.37 for the year, compared to US$2.98 in the prior year as shown in the bridge graph below:
*Non-GAAP performance measure. See end of news release
Operations Analysis - Continued
Fourth Quarter Results
Gibraltar produced 34.2 million pounds of copper for the quarter which was generally consistent with the prior quarter. Slightly lower throughput of 7.6 million tons was offset by higher grade compared to the prior quarter. Copper grades in the fourth quarter were 0.27%, higher than recent quarters and in line with management expectations as the lower benches of the Gibraltar pit provided higher grades and more consistent mineralized zones.
Copper recoveries in the fourth quarter were 82.2% and were impacted by performance in concentrator #2 prior to a major component replacement that was completed in January.
Total site costs* at Gibraltar of $110.6 million (which includes capitalized stripping of $31.9 million) was $8.6 million higher than the prior quarter due to higher labor cost, grinding media cost and timing of repairs and maintenance. Site operating cost per ton milled* was $9.72 and was lower than the previous quarters in 2023 mainly due to higher capitalized stripping costs.
Molybdenum production was 369 thousand pounds in the fourth quarter. At an average molybdenum price of US$18.64 per pound and the impact of negative price adjustments of $1.8 million for Taseko’s 87.5% share, molybdenum generated a by-product credit per pound of copper produced of US$0.13 in the fourth quarter.
Off-property costs per pound produced* were US$0.45 for the fourth quarter reflecting higher sales, higher ocean freight costs (including bunker fuel) and increased TCRCs compared to the same quarter in the prior year.
Total operating costs per pound produced (C1)* was US$1.91 for the quarter and was lower than the previous quarter due to increased waste stripping costs being capitalized from the Connector pit.
Gibraltar Outlook
The Gibraltar pit will continue to be the main source of mill feed for the first half of 2024 before mining of ore transitions into the Connector pit in the second half of the year. Stripping activity will continue to be focused in the Connector pit, and further oxide ore from this pit is expected to be added to the leach pads in 2024. Restart of the SX/EW facility at the Gibraltar mine is expected in 2026.
Concentrator #2 had additional downtime in January 2024 for a planned major component replacement, and concentrator #1 is scheduled to be down for three weeks in June for the in-pit crusher relocation and other mill maintenance. After taking into account the reduced mill availability from these two scheduled down times, total copper production at Gibraltar for 2024 is expected to be approximately 115 million pounds.
The estimated remaining capital cost of the crusher relocation project is $10 million, and no other significant capital projects are planned for Gibraltar in 2024.
The Company continues to purchase options to provide copper price and fuel price protection. Currently, the Company has copper put contracts in place that secure a minimum copper price of US$3.25 per pound for 42 million pounds of copper and diesel call options for 12.5 million litres of diesel, covering the first half of 2024.
*Non-GAAP performance measure. See end of news release
Florence Copper
On September 14, 2023, the Company received the final UIC permit from the EPA, and the UIC permit became effective on October 31, 2023. The Company now has all the key permits in place for the commercial production facility and is commencing construction.
Site activities to-date have focused on site preparations, earthworks and civil work for the commercial wellfield and the hiring of additional management and site personnel positions for the construction and operations teams. The initial drilling contracts have been awarded and finalized, and drilling of the commercial facility wellfield commenced in February.
The Company recently executed a fixed-price contract with the general contractor for construction of the SX/EW plant and associated surface infrastructure which is scheduled to commence in the second quarter of 2024. All the major plant components are on site and the early work on detailed engineering and procurement of long-lead items has significantly de-risked the construction schedule. First copper production is expected in the fourth quarter of 2025.
The Company has advanced Florence project level financing to fund construction. In the fourth quarter, the Company closed a US$25 million equipment loan with Bank of America. In January 2024, the Company received the initial US$10 million deposit from the US$50 million streaming transaction with Mitsui. The remaining amounts will be paid on a quarterly basis in US$10 million instalments. On February 2, 2024, the Company closed a US$50 million royalty with Taurus, which was funded in one lump-sum payment at that time. Additionally, in October 2023, the Florence project received a credit committee approved commitment from Societe Generale for a US$50 million project debt facility with an additional US$25 million uncommitted accordion feature.
In March 2023, the Company announced the results of recent technical work and updated economics for the Florence Copper project. The Company has a technical report entitled “NI 43-101 Technical Report Florence Copper Project, Pinal County, Arizona” dated March 30, 2023 (the “Technical Report”) on SEDAR. The Technical Report was prepared in accordance with NI 43-101 and incorporates updated capital and operating costs (with a basis as of Q3 2022) for the commercial production facility and refinements made to the operating models, based on the Production Test Facility (“PTF”) results.
Florence Copper Project Highlights:
- Net present value of US$930 million (after-tax at an 8% discount rate)
- Internal rate of return of 47% (after-tax)
- Payback period of 2.6 years
- Operating costs (C1) of US$1.11 per pound of copper
- Annual production capacity of 85 million pounds of LME grade A cathode copper
- 22 year mine life
- Total life of mine production of 1.5 billion pounds of copper
- Total estimated initial capital cost of US$232 million remaining
- Long-term copper price of US$3.75 per pound
Long-term Growth Strategy
Taseko’s strategy has been to grow the Company by acquiring and developing a pipeline of complementary projects focused on copper in stable mining jurisdictions. We continue to believe this will generate long-term returns for shareholders. Our other development projects are located in British Columbia.
Yellowhead Copper Project
Yellowhead Mining Inc. (“Yellowhead”) has an 817 million tonnes reserve and a 25-year mine life with a pre-tax net present value of $1.3 billion at an 8% discount rate using a US$3.10 per pound copper price based on the Company’s 2020 NI 43-101 technical report. Capital costs of the project are estimated at $1.3 billion over a 2-year construction period. During the first 5 years of operation, the copper equivalent grade will average 0.35% producing an average of 200 million pounds of copper per year at an average C1* cost, net of by-product credit, of US$1.67 per pound of copper produced. The Yellowhead copper project contains valuable precious metal by-products with 440,000 ounces of gold and 19 million ounces of silver with a life of mine value of over $1 billion at current prices.
The Company is preparing to advance into the environmental assessment process and is undertaking some additional engineering work in conjunction with ongoing engagement with local communities including First Nations. The Company is also collecting baseline data and modeling which will be used to support the environmental assessment and permitting of the project.
New Prosperity Gold-Copper Project
In late 2019, the Tŝilhqot’in Nation, as represented by Tŝilhqot’in National Government, and Taseko Mines Limited entered into a confidential dialogue, with the involvement of the Province of British Columbia, seeking a long-term resolution of the conflict regarding Taseko’s proposed copper-gold mine previously known as New Prosperity, acknowledging Taseko’s commercial interests and the Tŝilhqot’in Nation’s opposition to the project.
This dialogue has been supported by the parties’ agreement, beginning December 2019, to a series of standstill agreements on certain outstanding litigation and regulatory matters relating to Taseko’s tenures and the area in the vicinity of Teztan Biny (Fish Lake).
The dialogue process has made meaningful progress in recent months but is not complete. The Tŝilhqot’in Nation and Taseko acknowledge the constructive nature of discussions, and the opportunity to conclude a long-term and mutually acceptable resolution of the conflict that also makes an important contribution to the goals of reconciliation in Canada.
In March 2024, Tŝilhqot’in and Taseko formally reinstated the standstill agreement for a final term, with the goal of finalizing a resolution before the end of this year.
Aley Niobium Project
Environmental monitoring and product marketing initiatives on the Aley niobium project continue. The converter pilot test is ongoing and is providing additional process data to support the design of the commercial process facilities and will provide final product samples for marketing purposes. The Company has also initiated a scoping study to investigate the potential production of niobium oxide at Aley to supply the growing market for niobium-based batteries.
Environmental, Social and Governance (“ESG”)
Nothing is more important to Taseko than the safety, health and well-being of our workers and their families. Taseko places a high priority on the continuous improvement of performance in the areas of employee health and safety at the workplace and protection of the environment.
The full report is available on the Company’s website at https://tasekomines.com/sustainability/overview/.
Taseko’s 2023 ESG report will be published in the second quarter of 2024.
Market Review
Prices (USD per pound for Commodities)
(Source Data: Bank of Canada, Platts Metals, and London Metals Exchange)
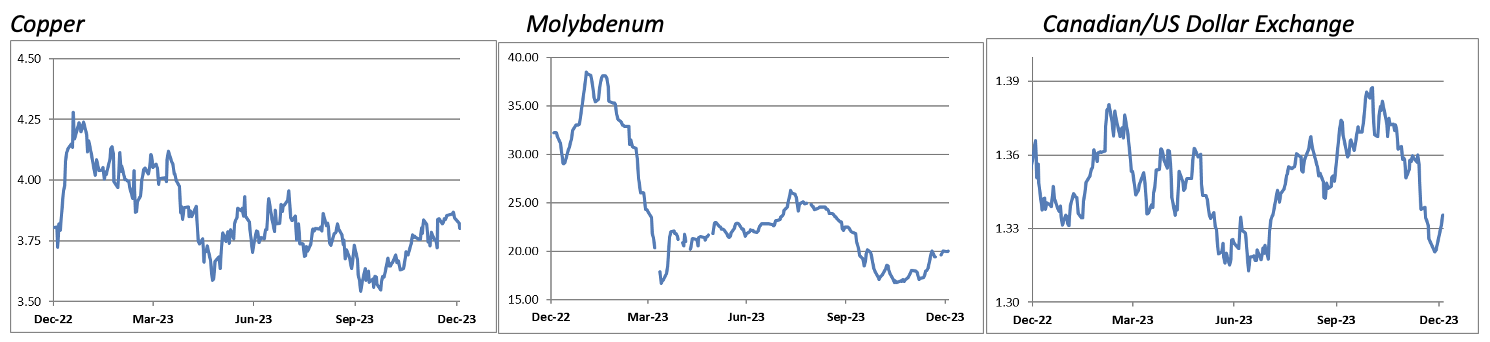
Copper prices are currently around US$3.90 per pound, compared to US$3.84 per pound at December 31, 2023. Short-term volatility in copper prices is expected to continue in the near term due to macroeconomic uncertainty, geopolitical events and recessionary risks from higher interest rates which is causing a slowdown in industrial demand.
Electrification of transportation and the focus on government investment in construction and infrastructure including initiatives focused on the renewable energy, electrification and meeting net zero targets by 2050, are inherently copper intensive and supports higher copper prices in the longer term. According to S&P Global’s copper market outlook report published in July 2022, titled ‘The Future of Copper: Will the looming supply gap short-circuit the energy transition?’, global demand for copper is projected to double from approximately 25 million metric tons today to roughly 50 million metric tons by 2035, a record high that will be sustained and continue to grow to 53 million metric tons by 2050, in order to achieve net-zero targets. All of these factors continue to provide unprecedented catalysts for higher copper prices in the future as new mine supply lags growth in copper demand.
Approximately 4% of the Company’s revenue is made up of molybdenum sales. During the fourth quarter of 2023, the average molybdenum price was US$18.64 per pound. Molybdenum prices are currently around US$20 per pound. Molybdenum demand and prices have been driven by supply challenges at large South American copper mines that produce molybdenum as a by-product. Continued strong demand from the energy sector has boosted demand for alloyed steel products, as well as growing demand from the renewables and military sectors. The Company’s sales agreements specify molybdenum pricing based on the published Platts Metals reports.
Approximately 80% of the Gibraltar mine’s costs are Canadian dollar denominated and therefore, fluctuations in the Canadian/US dollar exchange rate can have a significant effect on the Company’s financial results.
The Company will host a telephone conference call and live webcast on Friday, March 8, 2024 at 11:00 a.m. Eastern Time (8:00 a.m. Pacific Time) to discuss these results. After opening remarks by management, there will be a question and answer session open to analysts and investors.
To join the conference call without operator assistance, you may pre-register at https://emportal.ink/41ycQtM to receive an instant automated call back just prior to the start of the conference call. Otherwise, the conference call may be accessed by dialing 888-390-0546 toll free, 416-764-8688 in Canada, or online at tasekomines.com/investors/events.
The conference call will be archived for later playback until March 15, 2024 and can be accessed by dialing 888-390-0541 toll free, 416-764-8677 in Canada, or online at tasekomines.com/investors/events/ and using the entry code 758609#.
For further information on Taseko, please see the Company's website at www.tasekomines.com or contact:
Brian Bergot, Vice President, Investor Relations – 778-373-4554, toll free 1-800-667-2114
Stuart McDonald
President & CEO
Non-GAAP Performance Measures
This document includes certain non-GAAP performance measures that do not have a standardized meaning prescribed by IFRS. These measures may differ from those used by, and may not be comparable to such measures as reported by, other issuers. The Company believes that these measures are commonly used by certain investors, in conjunction with conventional IFRS measures, to enhance their understanding of the Company’s performance. These measures have been derived from the Company’s financial statements and applied on a consistent basis. The following tables below provide a reconciliation of these non-GAAP measures to the most directly comparable IFRS measure.
Total operating costs and site operating costs, net of by-product credits
Total costs of sales include all costs absorbed into inventory, as well as transportation costs and insurance recoverable. Site operating costs are calculated by removing net changes in inventory, depletion and amortization, insurance recoverable, and transportation costs from cost of sales. Site operating costs, net of by-product credits is calculated by subtracting by-product credits from the site operating costs. Site operating costs, net of by-product credits per pound are calculated by dividing the aggregate of the applicable costs by copper pounds produced. Total operating costs per pound is the sum of site operating costs, net of by-product credits and off-property costs divided by the copper pounds produced. By-product credits are calculated based on actual sales of molybdenum (net of treatment costs) and silver during the period divided by the total pounds of copper produced during the period. These measures are calculated on a consistent basis for the periods presented.
Non-GAAP Performance Measures (Continued)
(Cdn$ in thousands, unless otherwise indicated) –
87.5% basis |
2023
Q41
|
2023
Q31
|
2023
Q21
|
2023
Q11
|
2023
YE
|
| Cost of sales |
93,914 |
94,383 |
99,854 |
86,407 |
374,558 |
| Less: |
|
|
|
|
|
| Depletion and amortization |
(13,326) |
(15,993) |
(15,594) |
(12,027) |
(56,940) |
| Net change in inventories of finished goods |
(1,678) |
4,267 |
3,356 |
(399) |
5,546 |
| Net change in inventories of ore stockpiles |
(3,771) |
12,172 |
2,724 |
5,561 |
16,686 |
| Transportation costs |
(10,294) |
(7,681) |
(6,966) |
(5,104) |
(30,045) |
| Site operating costs |
64,845 |
87,148 |
83,374 |
74,438 |
309,805 |
| Oxide ore stockpile reclassification from capitalized stripping |
- |
- |
(3,183) |
3,183 |
- |
| Less by-product credits: |
|
|
|
|
|
| Molybdenum, net of treatment costs |
(5,441) |
(9,900) |
(4,018) |
(9,208) |
(28,567) |
| Silver, excluding amortization of deferred revenue |
124 |
290 |
(103) |
(160) |
151 |
| Site operating costs, net of by-product credits |
59,528 |
77,538 |
76,070 |
68,253 |
281,389 |
| Total copper produced (thousand pounds) |
29,883 |
30,978 |
24,640 |
19,491 |
104,992 |
| Total costs per pound produced |
1.99 |
2.50 |
3.09 |
3.50 |
2.68 |
| Average exchange rate for the period (CAD/USD) |
1.36 |
1.34 |
1.34 |
1.35 |
1.35 |
| Site operating costs, net of by-product credits (US$ per pound) |
1.46 |
1.87 |
2.30 |
2.59 |
1.99 |
| Site operating costs, net of by-product credits |
59,528 |
77,538 |
76,070 |
68,253 |
281,389 |
| Add off-property costs: |
|
|
|
|
|
| Treatment and refining costs |
7,885 |
6,123 |
4,986 |
4,142 |
23,136 |
| Transportation costs |
10,294 |
7,681 |
6,966 |
5,104 |
30,045 |
| Total operating costs |
77,707 |
91,342 |
88,022 |
77,499 |
334,570 |
| Total operating costs (C1) (US$ per pound) |
1.91 |
2.20 |
2.66 |
2.94 |
2.37 |
1 Q1, Q2, Q3 and Q4 2023 includes the impact from the March 15, 2023 acquisition of Cariboo from Sojitz, which increased the Company’s Gibraltar mine ownership from 75% to 87.5%.
Non-GAAP Performance Measures (Continued)
|
(Cdn$ in thousands, unless otherwise indicated) –
75% basis
|
2022
Q4
|
2022
Q3
|
2022
Q2
|
2022
Q1
|
2022
YE
|
| Cost of sales |
73,112 |
84,204 |
90,992 |
89,066 |
337,374 |
| Less: |
|
|
|
|
|
| Depletion and amortization |
(10,147) |
(13,060) |
(15,269) |
(13,506) |
(51,982) |
| Net change in inventories of finished goods |
1,462 |
2,042 |
(3,653) |
(7,577) |
(7,726) |
| Net change in inventories of ore stockpiles |
18,050 |
3,050 |
(3,463) |
(3,009) |
14,628 |
| Transportation costs |
(6,671) |
(6,316) |
(4,370) |
(5,115) |
(22,472) |
| Site operating costs |
75,806 |
69,920 |
64,237 |
59,859 |
269,822 |
| Oxide ore stockpile reclassification from capitalized stripping |
- |
- |
|
|
- |
| Less by-product credits: |
|
|
|
|
|
| Molybdenum, net of treatment costs |
(11,022) |
(4,122) |
(3,023) |
(3,831) |
(21,999) |
| Silver, excluding amortization of deferred revenue |
263 |
25 |
36 |
202 |
526 |
| Site operating costs, net of by-product credits |
65,047 |
65,823 |
61,250 |
56,230 |
248,349 |
| Total copper produced (thousand pounds) |
20,020 |
21,238 |
15,497 |
16,024 |
72,778 |
| Total costs per pound produced |
3.25 |
3.10 |
3.95 |
3.51 |
3.41 |
| Average exchange rate for the period (CAD/USD) |
1.36 |
1.31 |
1.28 |
1.27 |
1.30 |
| Site operating costs, net of by-product credits (US$ per pound) |
2.39 |
2.37 |
3.10 |
2.77 |
2.62 |
| Site operating costs, net of by-product credits |
65,047 |
65,823 |
61,250 |
56,230 |
248,349 |
| Add off-property costs: |
|
|
|
|
|
| Treatment and refining costs |
3,104 |
3,302 |
2,948 |
2,133 |
11,486 |
| Transportation costs |
6,671 |
6,316 |
4,370 |
5,115 |
22,472 |
| Total operating costs |
74,822 |
75,441 |
68,568 |
63,478 |
282,307 |
| Total operating costs (C1) (US$ per pound) |
2.75 |
2.72 |
3.47 |
3.13 |
2.98 |
Non-GAAP Performance Measures (Continued)
Total Site Costs
Total site costs are comprised of the site operating costs charged to cost of sales as well as mining costs capitalized to property, plant and equipment in the period. This measure is intended to capture Taseko’s share of the total site operating costs incurred in the quarter at the Gibraltar mine calculated on a consistent basis for the periods presented.
(Cdn$ in thousands, unless otherwise indicated) –
87.5% basis (except for Q1 2023) |
2023
Q4
|
2023
Q3
|
2023
Q2
|
2023
Q11
|
2023
YE1
|
| Site operating costs |
64,845 |
87,148 |
83,374 |
74,438 |
309,805 |
| Add: |
|
|
|
|
|
| Capitalized stripping costs |
31,916 |
2,083 |
8,832 |
12,721 |
55,552 |
| Total site costs – Taseko share |
96,761 |
89,231 |
92,206 |
87,159 |
365,357 |
| Total site costs – 100% basis |
110,584 |
101,978 |
105,378 |
112,799 |
430,739 |
1 Q1 2023 includes the impact from the March 15, 2023 acquisition of Cariboo from Sojitz, which increased the Company’s Gibraltar mine ownership from 75% to 87.5%.
(Cdn$ in thousands, unless otherwise indicated) –
75% basis |
2022
Q4
|
2022
Q3
|
2022
Q2
|
2022
Q1
|
2022
YE
|
| Site operating costs |
75,806 |
69,920 |
64,237 |
59,859 |
269,822 |
| Add: |
|
|
|
|
|
| Capitalized stripping costs |
3,866 |
1,121 |
11,887 |
15,142 |
32,016 |
| Total site costs – Taseko share |
79,672 |
71,041 |
76,124 |
75,001 |
301,838 |
| Total site costs – 100% basis |
106,230 |
94,721 |
101,499 |
100,001 |
402,451 |
Adjusted net income (loss) and Adjusted EPS
Adjusted net income (loss) removes the effect of the following transactions from net income as reported under IFRS:
- Unrealized foreign currency gains/losses;
- Unrealized gain/loss on derivatives;
- Gain on Cariboo acquisition; and
- Finance and other non-recurring costs.
Management believes these transactions do not reflect the underlying operating performance of our core mining business and are not necessarily indicative of future operating results. Furthermore, unrealized gains/losses on derivative instruments, changes in the fair value of financial instruments, and unrealized foreign currency gains/losses are not necessarily reflective of the underlying operating results for the reporting periods presented.
Adjusted EPS is the Adjusted net income attributable to common shareholders of the Company divided by the weighted average number of common shares outstanding during the period.
Non-GAAP Performance Measures (Continued)
Adjusted net income (loss) and Adjusted EPS (Continued)
| (Cdn$ in thousands, except per share amounts) |
2023
Q4
|
2023
Q3
|
2023
Q2
|
2023
Q1
|
2023
YE
|
| Net income |
67,425 |
871 |
9,991 |
4,439 |
82,726 |
| Unrealized foreign exchange (gain) loss |
(14,541) |
14,582 |
(10,966) |
(950) |
(11,875) |
| Unrealized loss (gain) on derivatives |
1,636 |
4,518 |
(6,470) |
2,190 |
1,874 |
| Gain on Cariboo acquisition |
(46,212) |
- |
- |
- |
(46,212) |
| Finance and other non-recurring costs |
(916) |
1,244 |
1,714 |
- |
2,042 |
| Estimated tax effect of adjustments |
16,668 |
(1,556) |
1,355 |
(591) |
15,876 |
| Adjusted net income (loss) |
24,060 |
19,659 |
(4,376) |
5,088 |
44,431 |
| Adjusted EPS |
0.08 |
0.07 |
(0.02) |
0.02 |
0.15 |
| (Cdn$ in thousands, except per share amounts) |
2022
Q4
|
2022
Q3
|
2022
Q2
|
2022
Q1
|
2022
YE
|
| Net (loss) income |
(2,275) |
(23,517) |
(5,274) |
5,095 |
(25,971) |
| Unrealized foreign exchange (gain) loss |
(5,279) |
28,083 |
11,621 |
(4,398) |
30,027 |
| Unrealized loss (gain) on derivatives |
20,137 |
(72) |
(30,747) |
7,486 |
(3,196) |
| Estimated tax effect of adjustments |
(5,437) |
19 |
8,302 |
(2,021) |
863 |
| Adjusted net income (loss) |
7,146 |
4,513 |
(16,098) |
6,162 |
1,723 |
| Adjusted EPS |
0.02 |
0.02 |
(0.06) |
0.02 |
0.01 |
Adjusted EBITDA
Adjusted EBITDA is presented as a supplemental measure of the Company’s performance and ability to service debt. Adjusted EBITDA is frequently used by securities analysts, investors and other interested parties in the evaluation of companies in the industry, many of which present Adjusted EBITDA when reporting their results. Issuers of “high yield” securities also present Adjusted EBITDA because investors, analysts and rating agencies consider it useful in measuring the ability of those issuers to meet debt service obligations.
Adjusted EBITDA represents net income before interest, income taxes, and depreciation and also eliminates the impact of a number of items that are not considered indicative of ongoing operating performance. Certain items of expense are added and certain items of income are deducted from net income that are not likely to recur or are not indicative of the Company’s underlying operating results for the reporting periods presented or for future operating performance and consist of:
- Unrealized foreign exchange gains/losses;
- Unrealized gain/loss on derivatives;
- Amortization of share-based compensation expense;
- Gain on Cariboo acquisition; and
- Non-recurring other expenses.
Non-GAAP Performance Measures (Continued)
Adjusted EBITDA (Continued)
| (Cdn$ in thousands) |
2023
Q4
|
2023
Q3
|
2023
Q2
|
2023
Q1
|
2023
YE
|
| Net income |
67,425 |
871 |
9,991 |
4,439 |
82,726 |
| Add: |
|
|
|
|
|
| Depletion and amortization |
13,326 |
15,993 |
15,594 |
12,027 |
56,940 |
| Finance expense |
12,804 |
14,285 |
13,468 |
12,309 |
52,866 |
| Finance income |
(972) |
(322) |
(757) |
(921) |
(2,972) |
| Income tax expense |
34,068 |
12,041 |
678 |
3,356 |
50,143 |
| Unrealized foreign exchange (gain) loss |
(14,541) |
14,582 |
(10,966) |
(950) |
(11,875) |
| Unrealized loss (gain) on derivatives |
1,636 |
4,518 |
(6,470) |
2,190 |
1,874 |
| Amortization of share-based compensation expense |
1,573 |
727 |
417 |
3,609 |
6,326 |
| Gain on Cariboo acquisition |
(46,212) |
- |
- |
- |
(46,212) |
| Non-recurring other expenses |
- |
- |
263 |
- |
263 |
| Adjusted EBITDA |
69,107 |
62,695 |
22,218 |
36,059 |
190,079 |
| (Cdn$ in thousands) |
2022
Q4
|
2022
Q3
|
2022
Q2
|
2022
Q1
|
2022
YE
|
| Net (loss) income |
(2,275) |
(23,517) |
(5,274) |
5,095 |
(25,971) |
| Add: |
|
|
|
|
|
| Depletion and amortization |
10,147 |
13,060 |
15,269 |
13,506 |
51,982 |
| Finance expense |
10,135 |
12,481 |
12,236 |
12,155 |
47,007 |
| Finance income |
(700) |
(650) |
(282) |
(166) |
(1,798) |
| Income tax expense |
1,222 |
3,500 |
922 |
1,188 |
6,832 |
| Unrealized foreign exchange (gain) loss |
(5,279) |
28,083 |
11,621 |
(4,398) |
30,027 |
| Unrealized loss (gain) on derivatives |
20,137 |
(72) |
(30,747) |
7,486 |
(3,196) |
| Amortization of share-based compensation expense (recovery) |
1,794 |
1,146 |
(2,061) |
3,273 |
4,152 |
| Adjusted EBITDA |
35,181 |
34,031 |
1,684 |
38,139 |
109,035 |
No regulatory authority has approved or disapproved of the information in this news release.
Caution Regarding Forward-Looking Information
This document contains “forward-looking statements” that were based on Taseko’s expectations, estimates and projections as of the dates as of which those statements were made. Generally, these forward-looking statements can be identified by the use of forward-looking terminology such as “outlook”, “anticipate”, “project”, “target”, “believe”, “estimate”, “expect”, “intend”, “should” and similar expressions.
Forward-looking statements are subject to known and unknown risks, uncertainties and other factors that may cause the Company’s actual results, level of activity, performance or achievements to be materially different from those expressed or implied by such forward-looking statements. These included but are not limited to:
- uncertainties about the effect of COVID-19 and the response of local, provincial, federal and international governments to the threat of COVID-19 on our operations (including our suppliers, customers, supply chain, employees and contractors) and economic conditions generally and in particular with respect to the demand for copper and other metals we produce;
- uncertainties and costs related to the Company’s exploration and development activities, such as those associated with continuity of mineralization or determining whether mineral resources or reserves exist on a property;
- uncertainties related to the accuracy of our estimates of mineral reserves, mineral resources, production rates and timing of production, future production and future cash and total costs of production and milling;
- uncertainties related to feasibility studies that provide estimates of expected or anticipated costs, expenditures and economic returns from a mining project;
- uncertainties related to the ability to obtain necessary licenses permits for development projects and project delays due to third party opposition;
- uncertainties related to unexpected judicial or regulatory proceedings;
- changes in, and the effects of, the laws, regulations and government policies affecting our exploration and development activities and mining operations, particularly laws, regulations and policies;
- changes in general economic conditions, the financial markets and in the demand and market price for copper, gold and other minerals and commodities, such as diesel fuel, steel, concrete, electricity and other forms of energy, mining equipment, and fluctuations in exchange rates, particularly with respect to the value of the U.S. dollar and Canadian dollar, and the continued availability of capital and financing;
- the effects of forward selling instruments to protect against fluctuations in copper prices and exchange rate movements and the risks of counterparty defaults, and mark to market risk;
- the risk of inadequate insurance or inability to obtain insurance to cover mining risks;
- the risk of loss of key employees; the risk of changes in accounting policies and methods we use to report our financial condition, including uncertainties associated with critical accounting assumptions and estimates;
- environmental issues and liabilities associated with mining including processing and stock piling ore; and
- labour strikes, work stoppages, or other interruptions to, or difficulties in, the employment of labour in markets in which we operate mines, or environmental hazards, industrial accidents or other events or occurrences, including third party interference that interrupt the production of minerals in our mines.
For further information on Taseko, investors should review the Company’s annual Form 40-F filing with the United States Securities and Exchange Commission www.sec.gov and home jurisdiction filings that are available at www.sedar.com.
Cautionary Statement on Forward-Looking Information
This discussion includes certain statements that may be deemed "forward-looking statements". All statements in this discussion, other than statements of historical facts, that address future production, reserve potential, exploration drilling, exploitation activities, and events or developments that the Company expects are forward-looking statements. Although we believe the expectations expressed in such forward-looking statements are based on reasonable assumptions, such statements are not guarantees of future performance and actual results or developments may differ materially from those in the forward-looking statements. Factors that could cause actual results to differ materially from those in forward-looking statements include market prices, exploitation and exploration successes, continued availability of capital and financing and general economic, market or business conditions. Investors are cautioned that any such statements are not guarantees of future performance and actual results or developments may differ materially from those projected in the forward-looking statements. All of the forward-looking statements made in this MD&A are qualified by these cautionary statements. We disclaim any intention or obligation to update or revise any forward-looking statements whether as a result of new information, future events or otherwise, except to the extent required by applicable law. Further information concerning risks and uncertainties associated with these forward-looking statements and our business may be found in our most recent Form 40-F/Annual Information Form on file with the SEC and Canadian provincial securities regulatory authorities.